Hirebridge contains a variety of reports on virtually every aspect of your recruitment process, however there are different ways to look at your data.
METRICS DURING A TIME PERIOD - ACTIVITY BASED REPORTS
Activity based reports will show a dataset based on what happened during a time period.
For example, an activity report for 6/1 - 615 might show more hires than offers, which in the FUNNEL BASED REPORTING would not happen, as this report strictly looks to what actually happened.
An example of this would be a CANDIDATE HIRE report, which will look to candidates who were hired during the particular date range, regardless of when those candidates entered the system.
The same HIRE number might be different with the Funnel Based Reports described below, as we would look to the comment pool of candidates who applied during the 6/1 - 6/15 time period, and then calculate the number of hires from that pool.
ACTIVITY BASED REPORTS
- Candidates
- Referrals
- Requisitions Created
- Requisitions Closed
- Offers
- Hires
METRICS DURING A TIME PERIOD - FUNNEL BASED REPORTS
Funnel reports (such as Candidate Summary - from Report Center and EEO Compliance Report) will perform all calculations from the initial pool of candidates who applied during that time period.
Example - All Candidates YTD will first calculate the number of candidates who have applied or were added via recruiter, import, email, etc. during the selected date range.
All of the numbers to the right of the initial candidate number will be calculated from that pool of candidates.
So, for instance, the candidate summary will show the number of phone screens, interviews, offers and hires, however that number is calculated from the the total number of candidates.
Pass Through - Effectiveness
These reports are a good indicator of pass-through rates, as it bases the results off of everyone who applied or was added during that time, so you can see how far that group of candidates has passed through the recruiting milestones in your process.
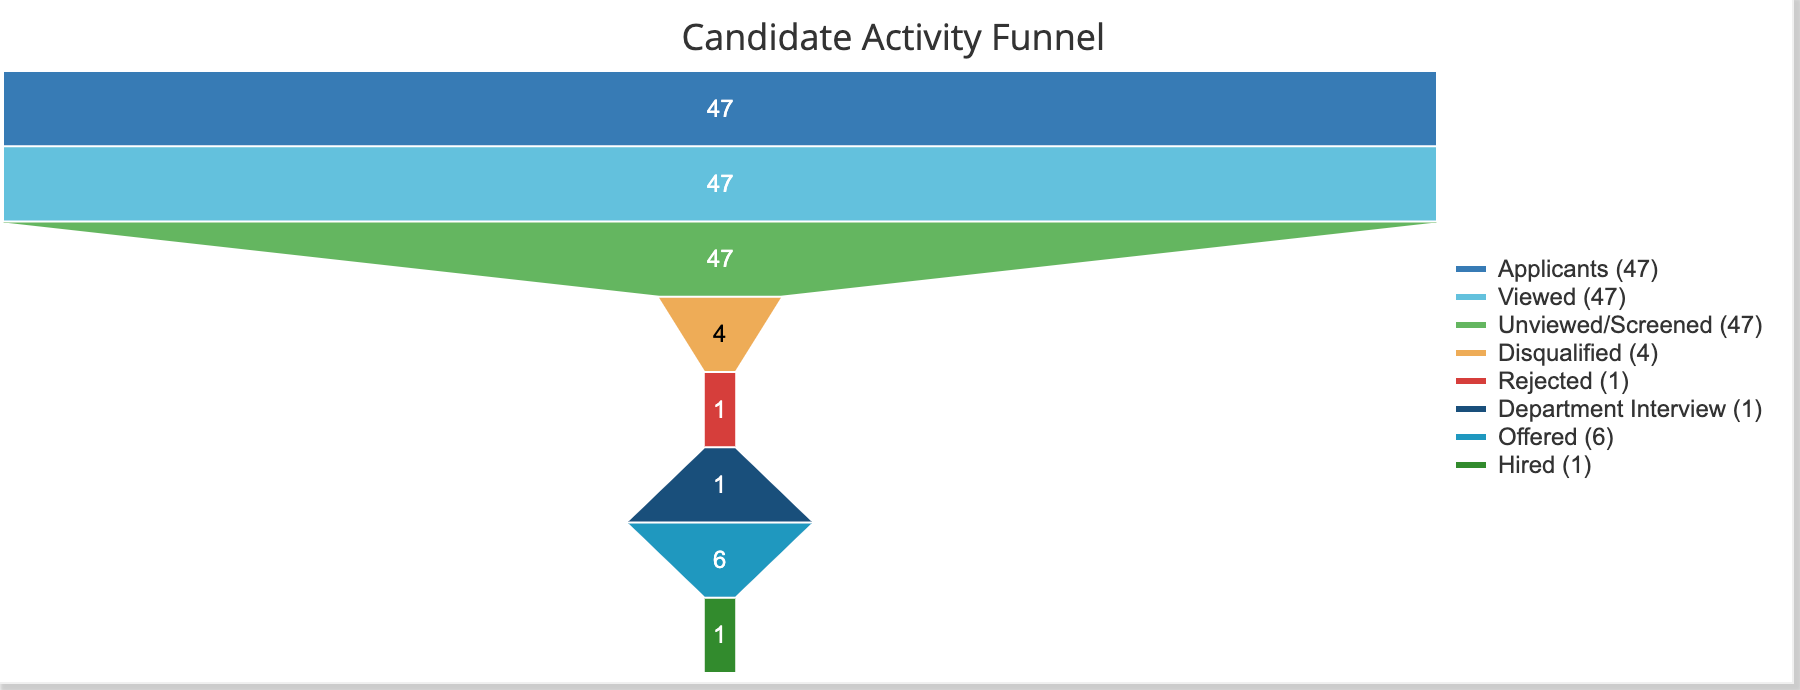
In the image below, we start with a pool of 47 candidates, and as you move through the funnel, the numbers decrease, up through the Hire step.