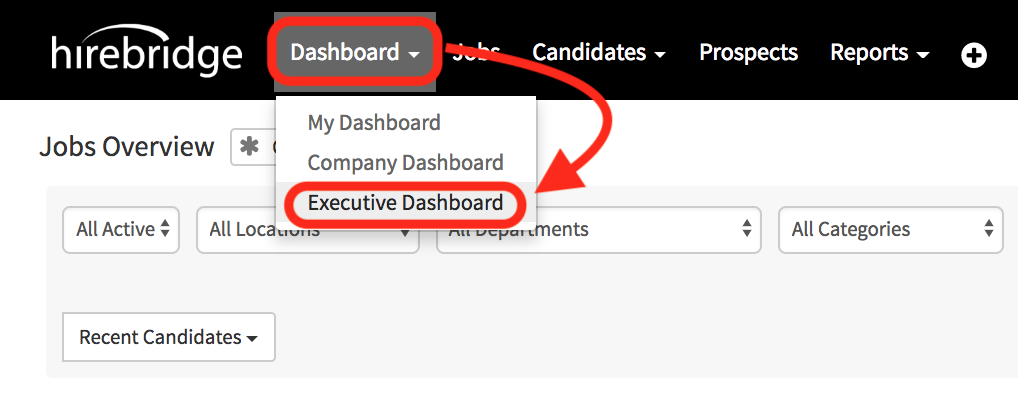
This article will give an overview of the Executive Dashboard.
- To locate the Executive Dashboard, in the navigation bar select the Dashboard tab.
- From the drop-down menu select "Executive Dashboard".
The executive dashboard will give you eleven reporting widgets that you can use and filter through. We will continue to make more KPI metrics widgets available over time.
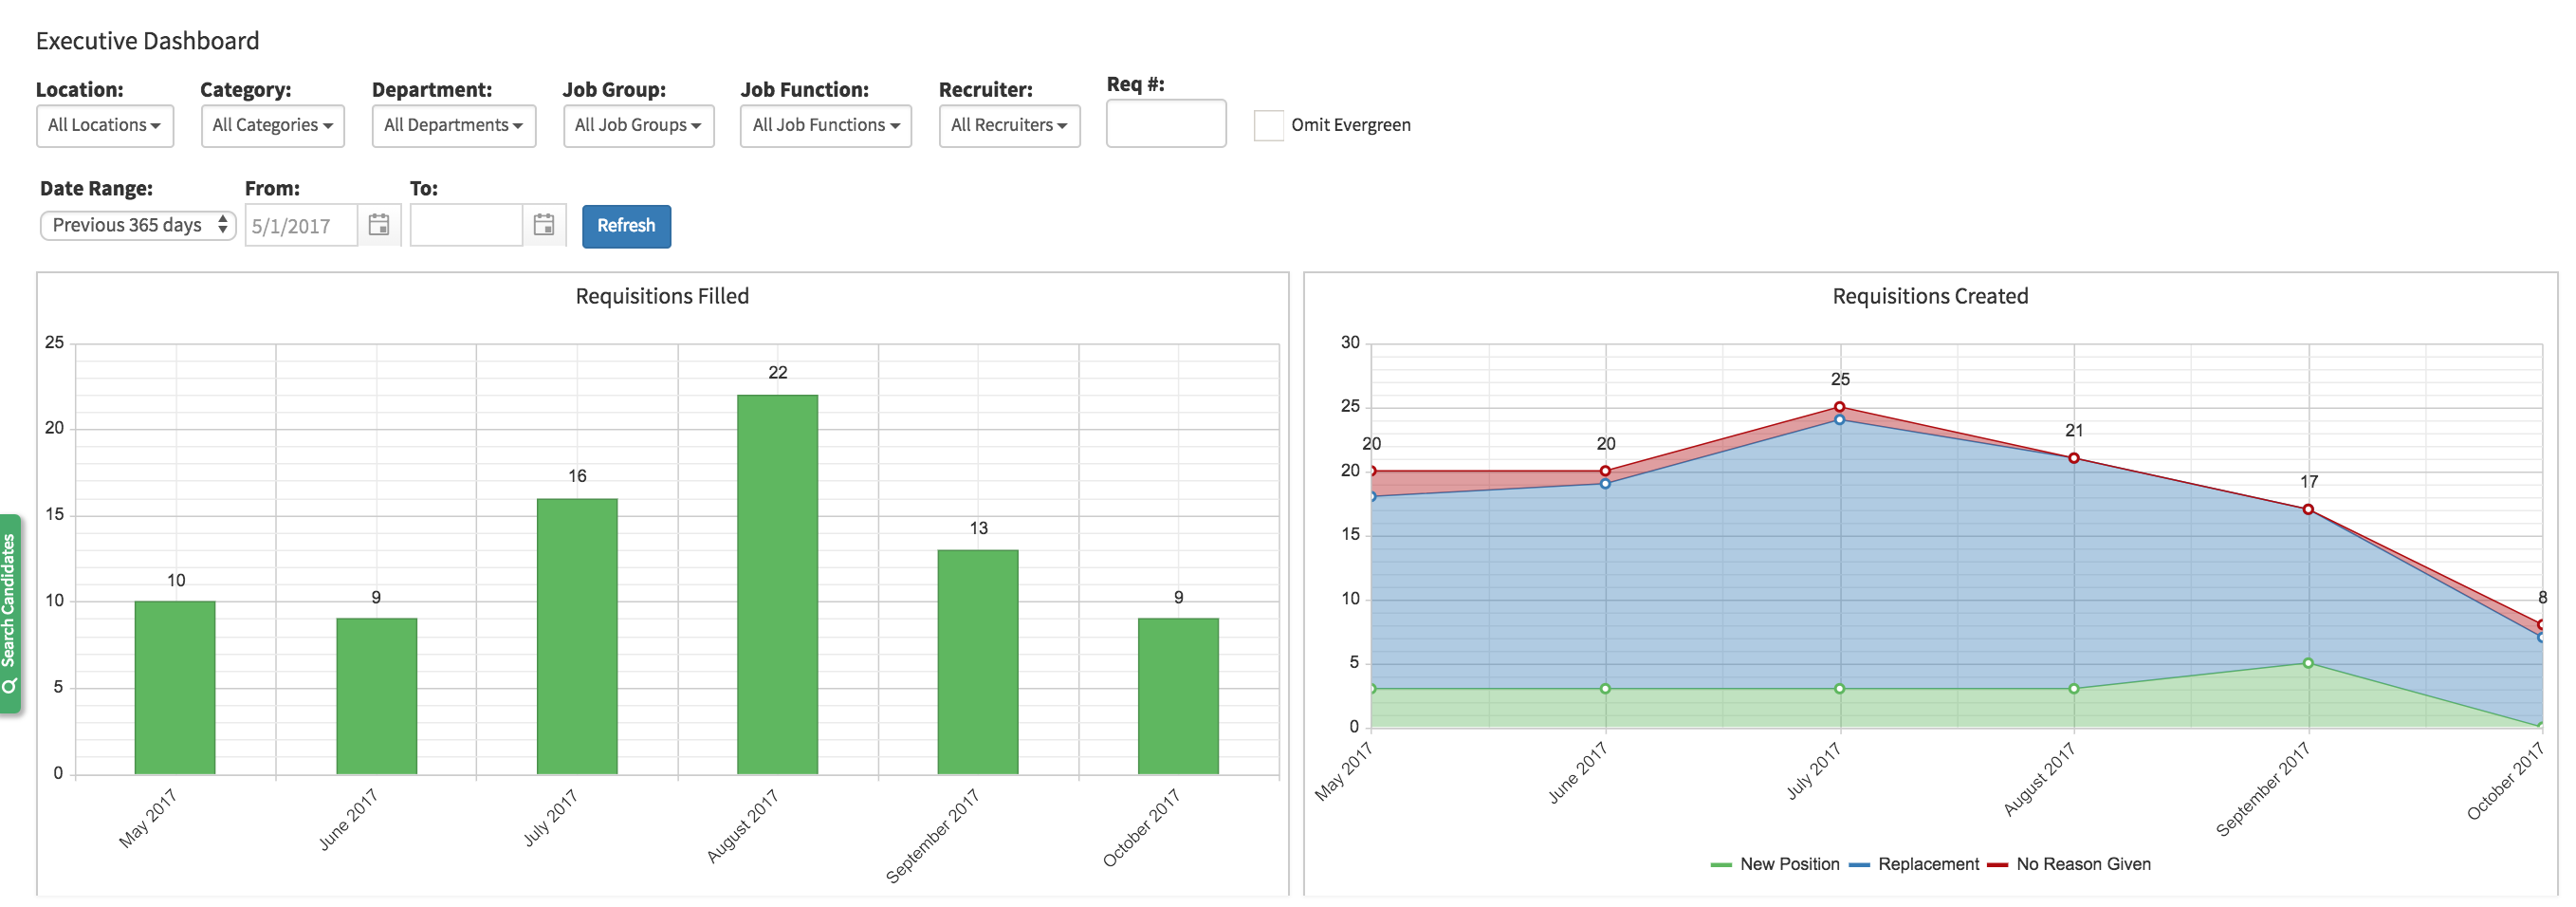
- The first section we will review is the filters section.
- This section will apply the filters to all of the widgets.

- Location - Filter Executive Dashboard by specific location
Category - Filter by specific company category
Department - Filter by company department
Job Group - Filter by specific job group
Job Function - Filter by job function
Recruiter - Filter by recruiter
Date Range -select a preset date range from the drop-down list.
From - Filter from starting date when the "custom" date is selected.
To - Filter end date when the "custom" date range is selected.
Omit Evergreen - Checking this filter removes all the "Evergreen" requisitions/candidates. - After selecting all of the filters you would like to apply to the reports by clicking on the blue "Refresh" button.
In the next section, we will review each of the reports.
The first report is the Requisitions Filled report. A filled requisition is a requisition that is CLOSED and marked as FILLED.
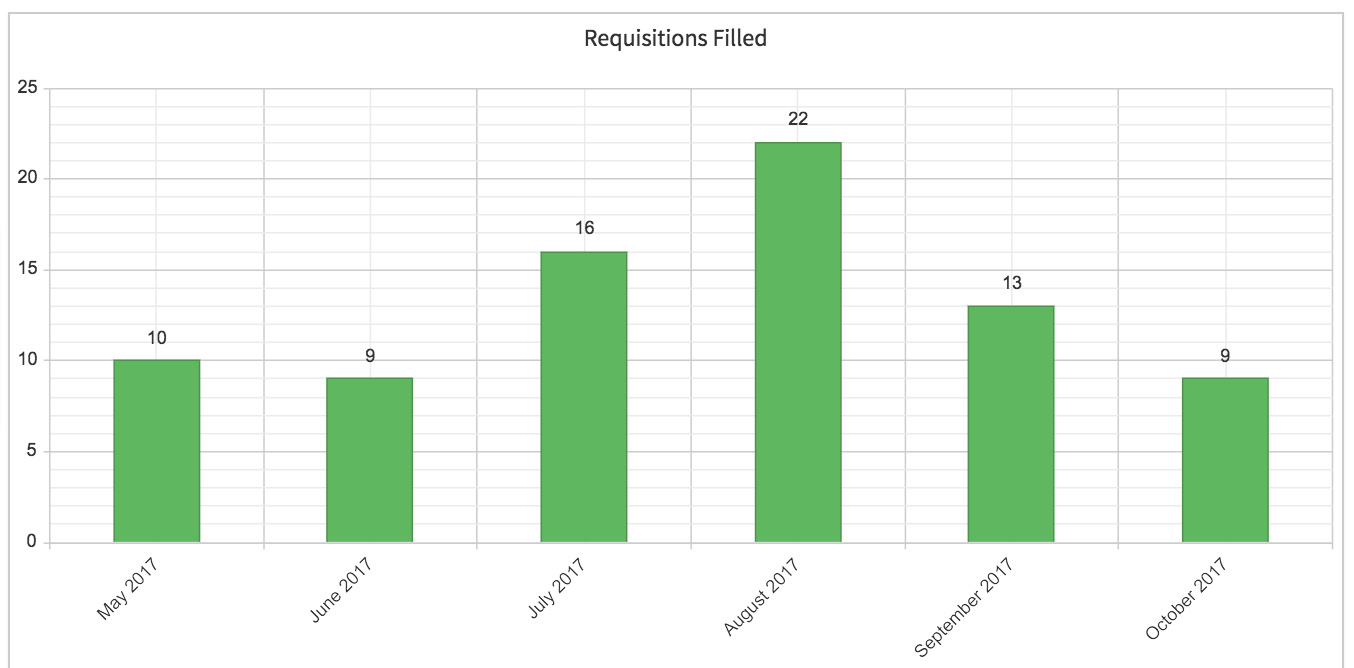
This report shows how many requisitions that have been filled within each month.
Requisitions Created
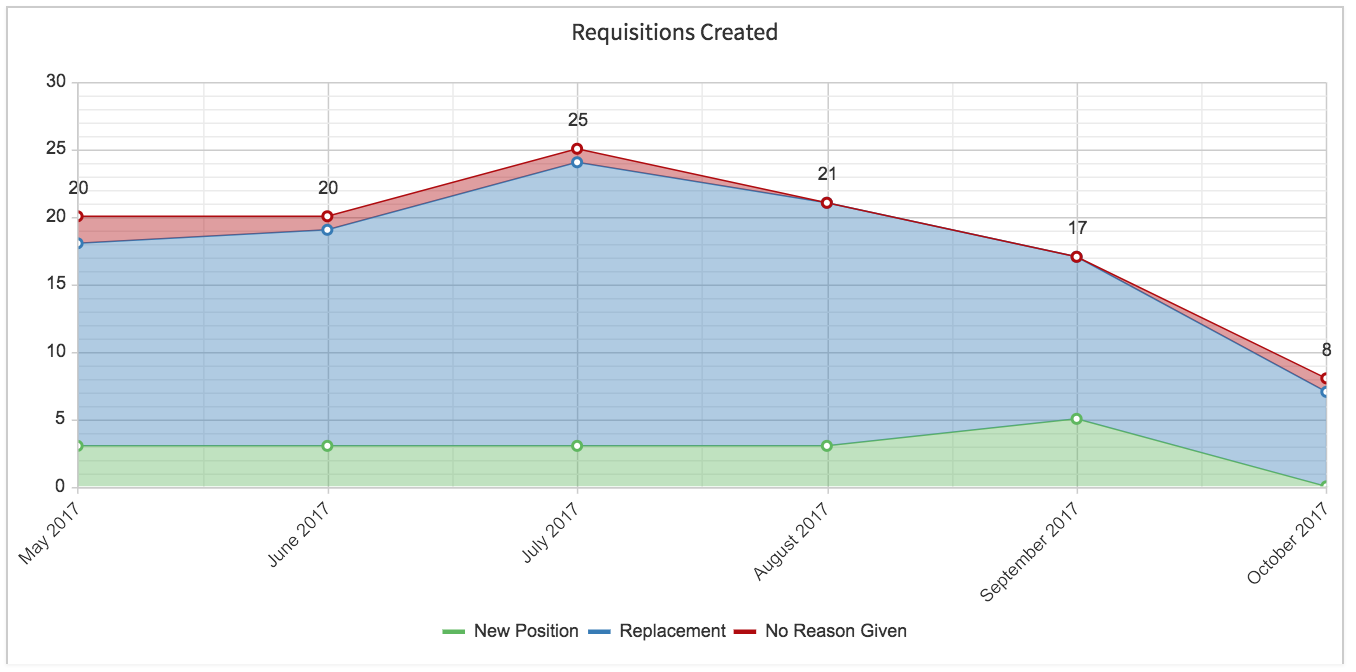
The Requisition Created report will show the requisitions created by month and reason for creation.
Average Time to Fill (Days)
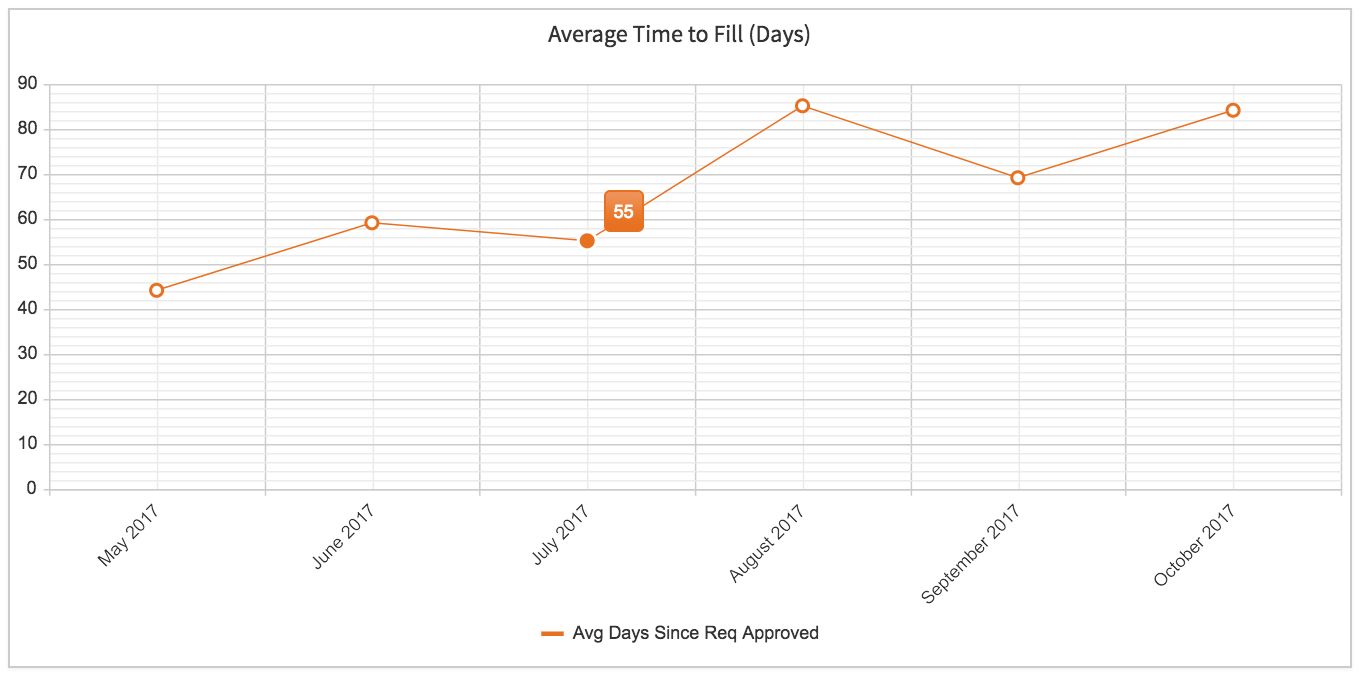
Average Time to Fill displays the average time that each requisition that closed in that time period took to fill.
Open Requisitions by Age
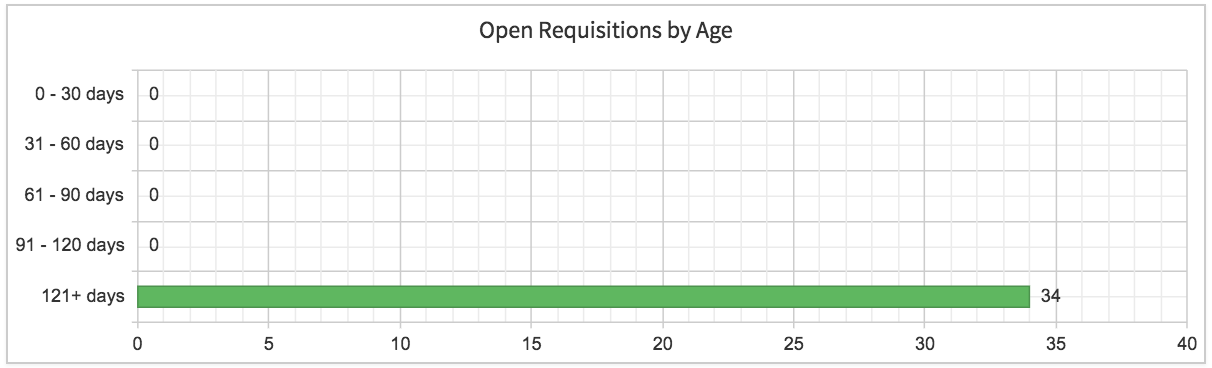
Open Requisitions by Age displays the number of requisitions that are open, and the time that they have been open in days.
Top Sources for Hires
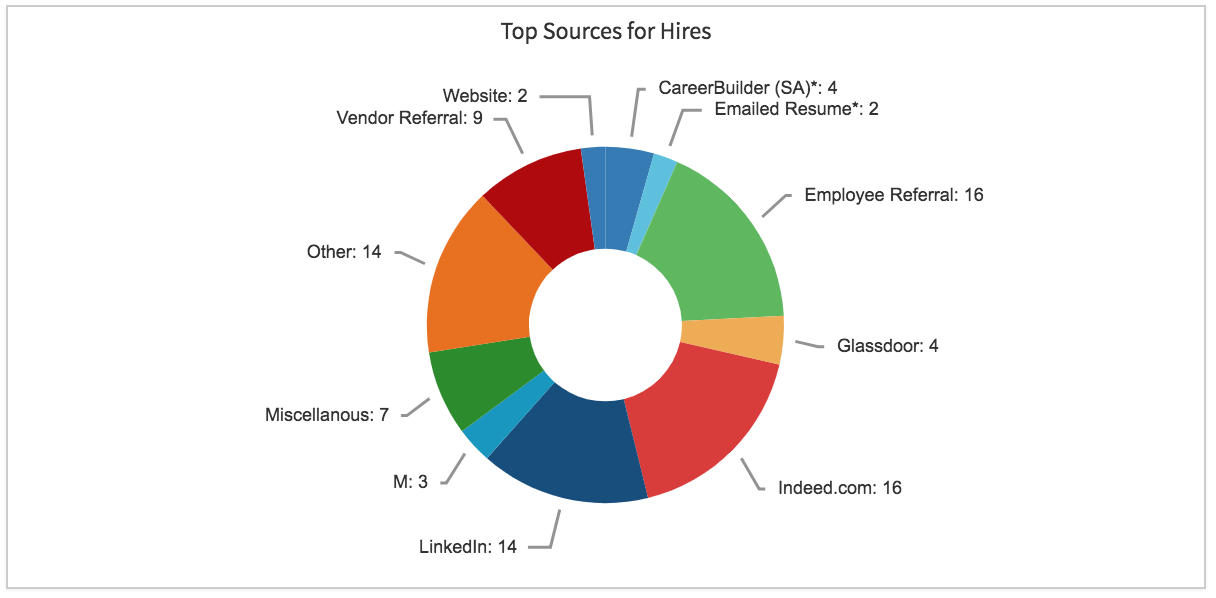
The Top Sources for Hires graph allows you to view where candidates have been sourced.
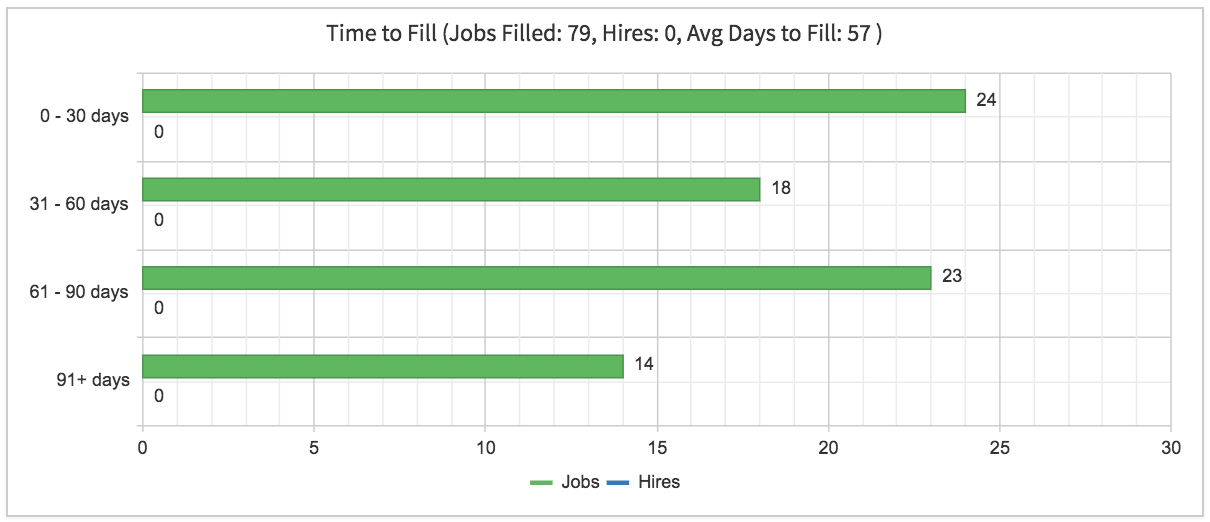
Time to Fill
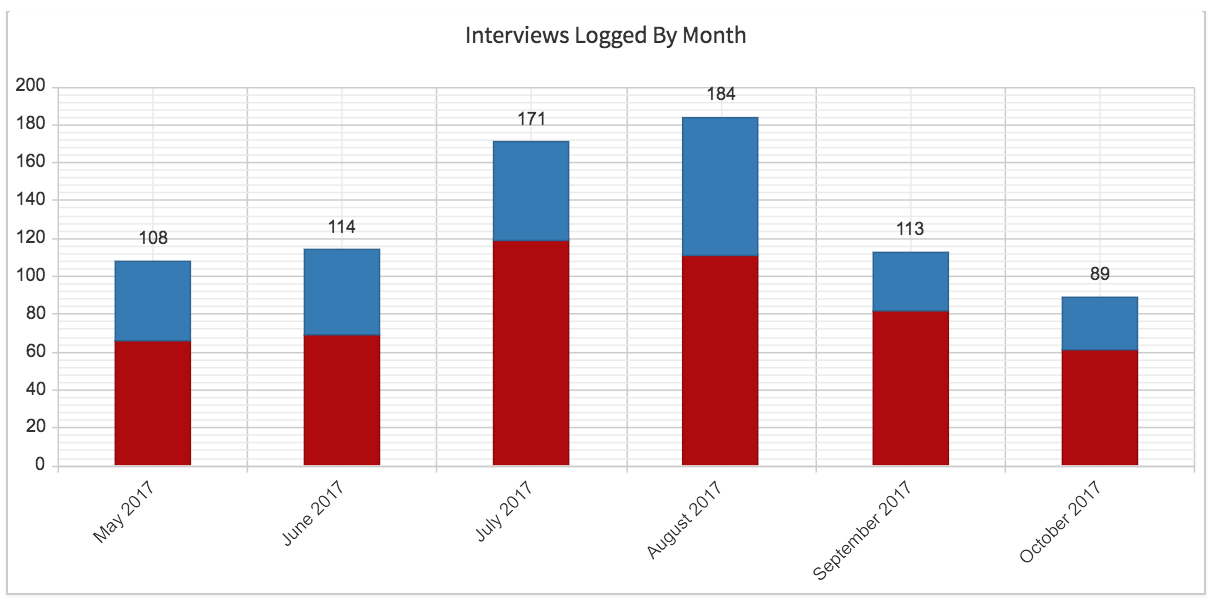
Interviews Logged by Month
Hires
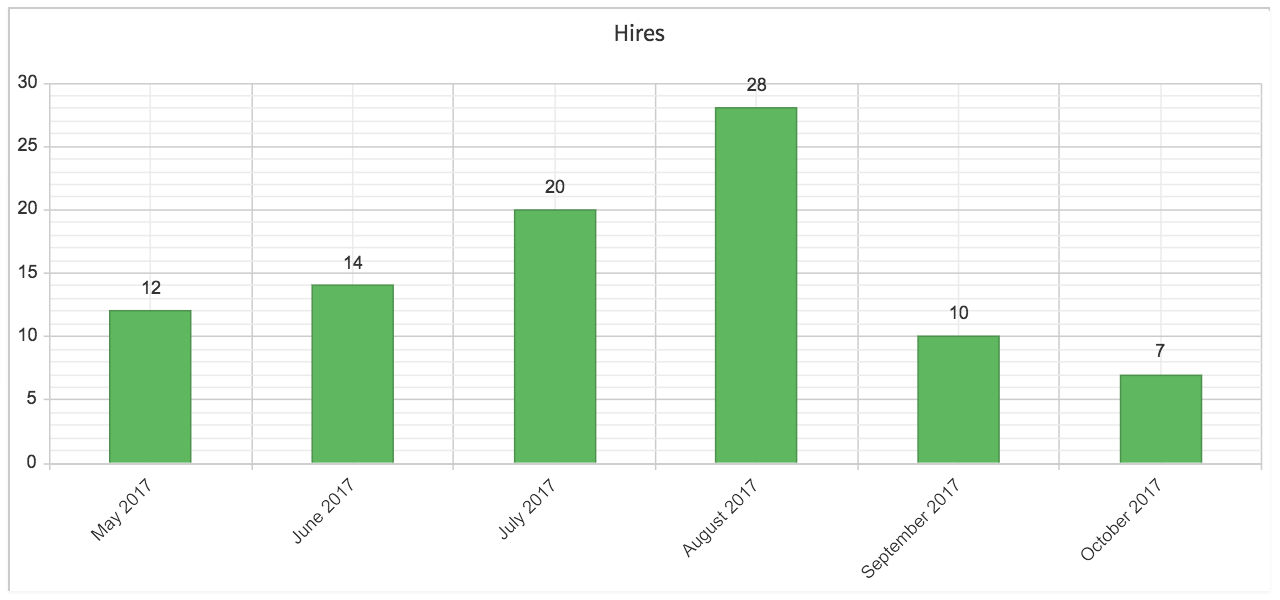
The hires graph will display the amount of hires per month
Requisitions Filled by Department
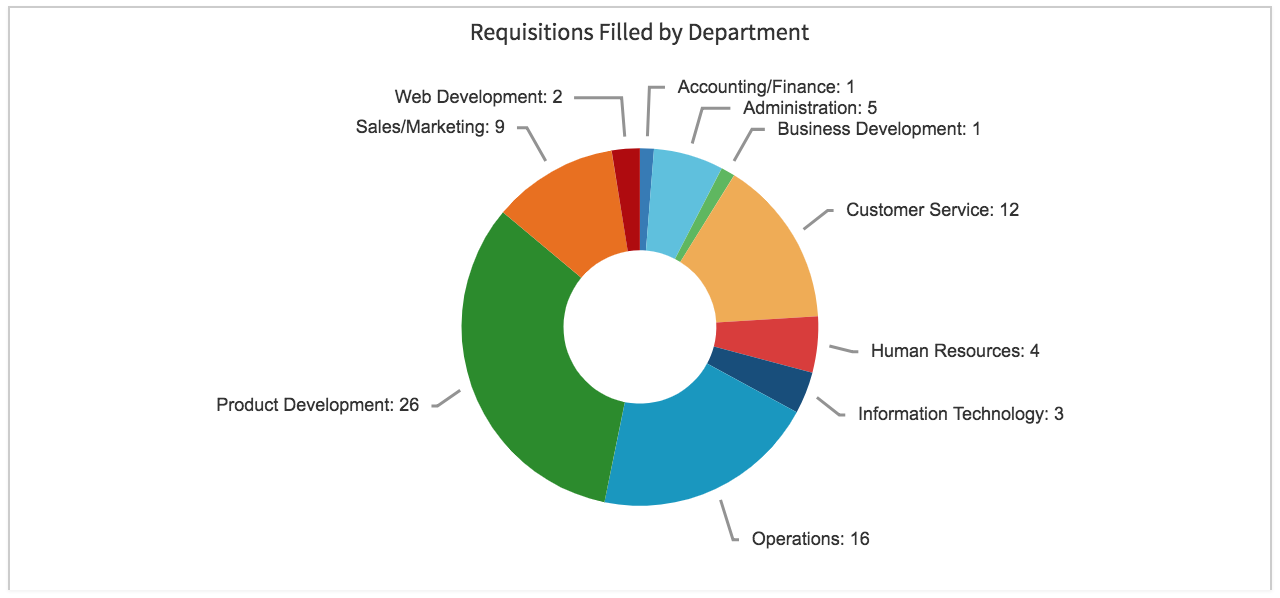
This report will show how many candidates have been hired within each department.
Average Time to Hire (Days)
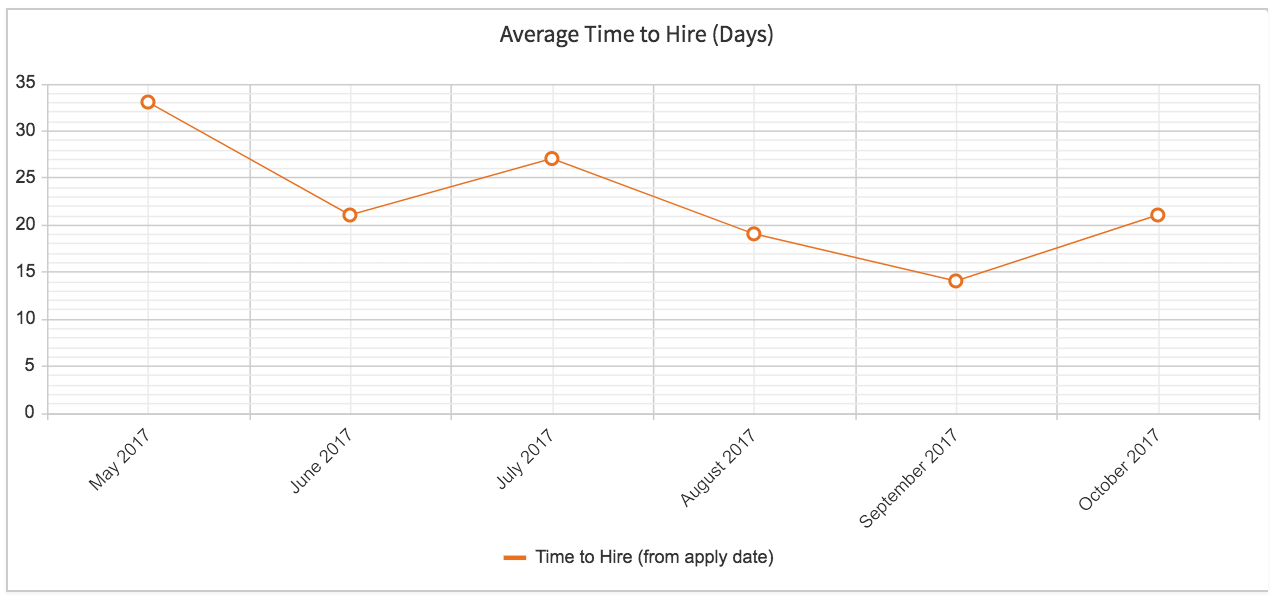
The Average Time to Hire report displays the average time in each month it takes for a candidate to be hired.
Candidates
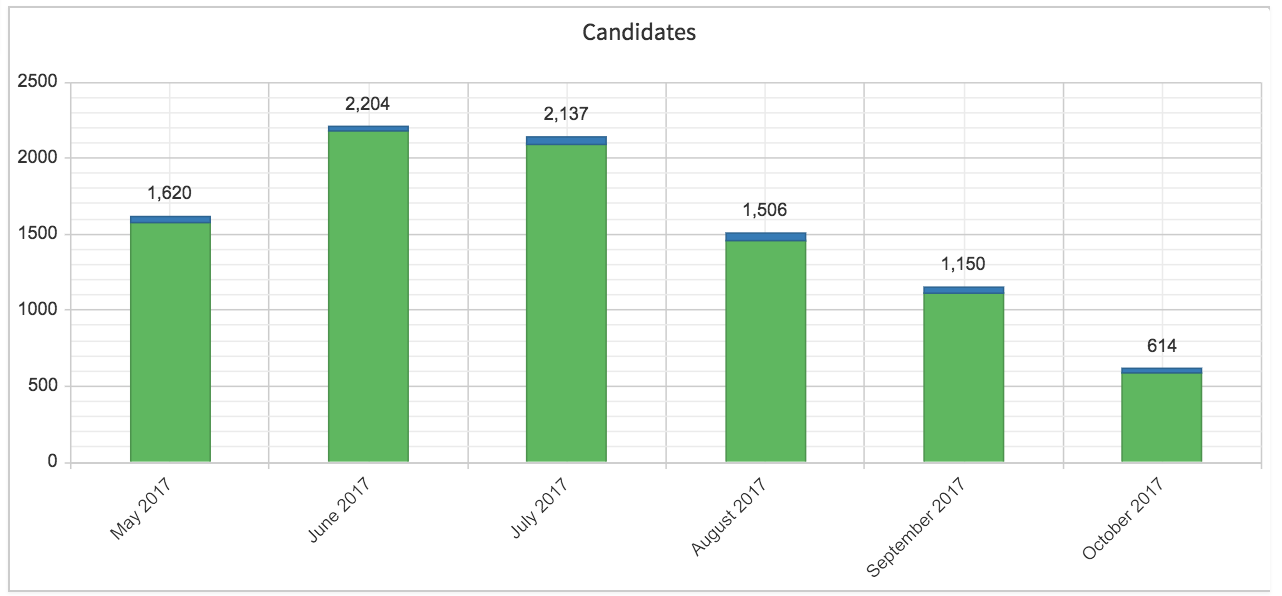
The Candidates report will show the total amount of applicants that have applied each month. The green will display the total amount of candidates applied and the blue display the amount of candidates sources. Hover the mouse over the color to display the exact number of applicants.