This article will cover the basics on how to access the candidate summary report.
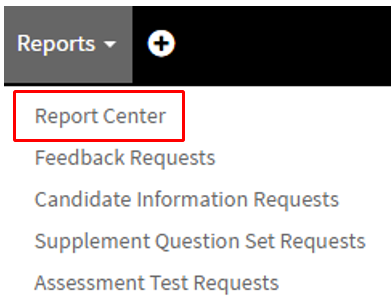
- The first step to access the Candidate Summary Report is by selecting the "Reports" tab in the navigation bar.

- In the drop-down menu select "Report Center"
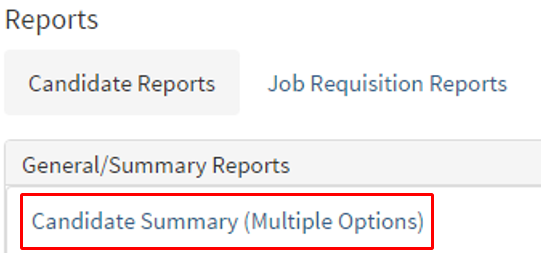
- Once in the Reports Center select "Candidate Reports" tab.
(Pictured below) - Next, select "Candidate Summary (Multiple Options)"
- If you are using the new "Report Center" select "Candidate Summary" report.
New Report Center
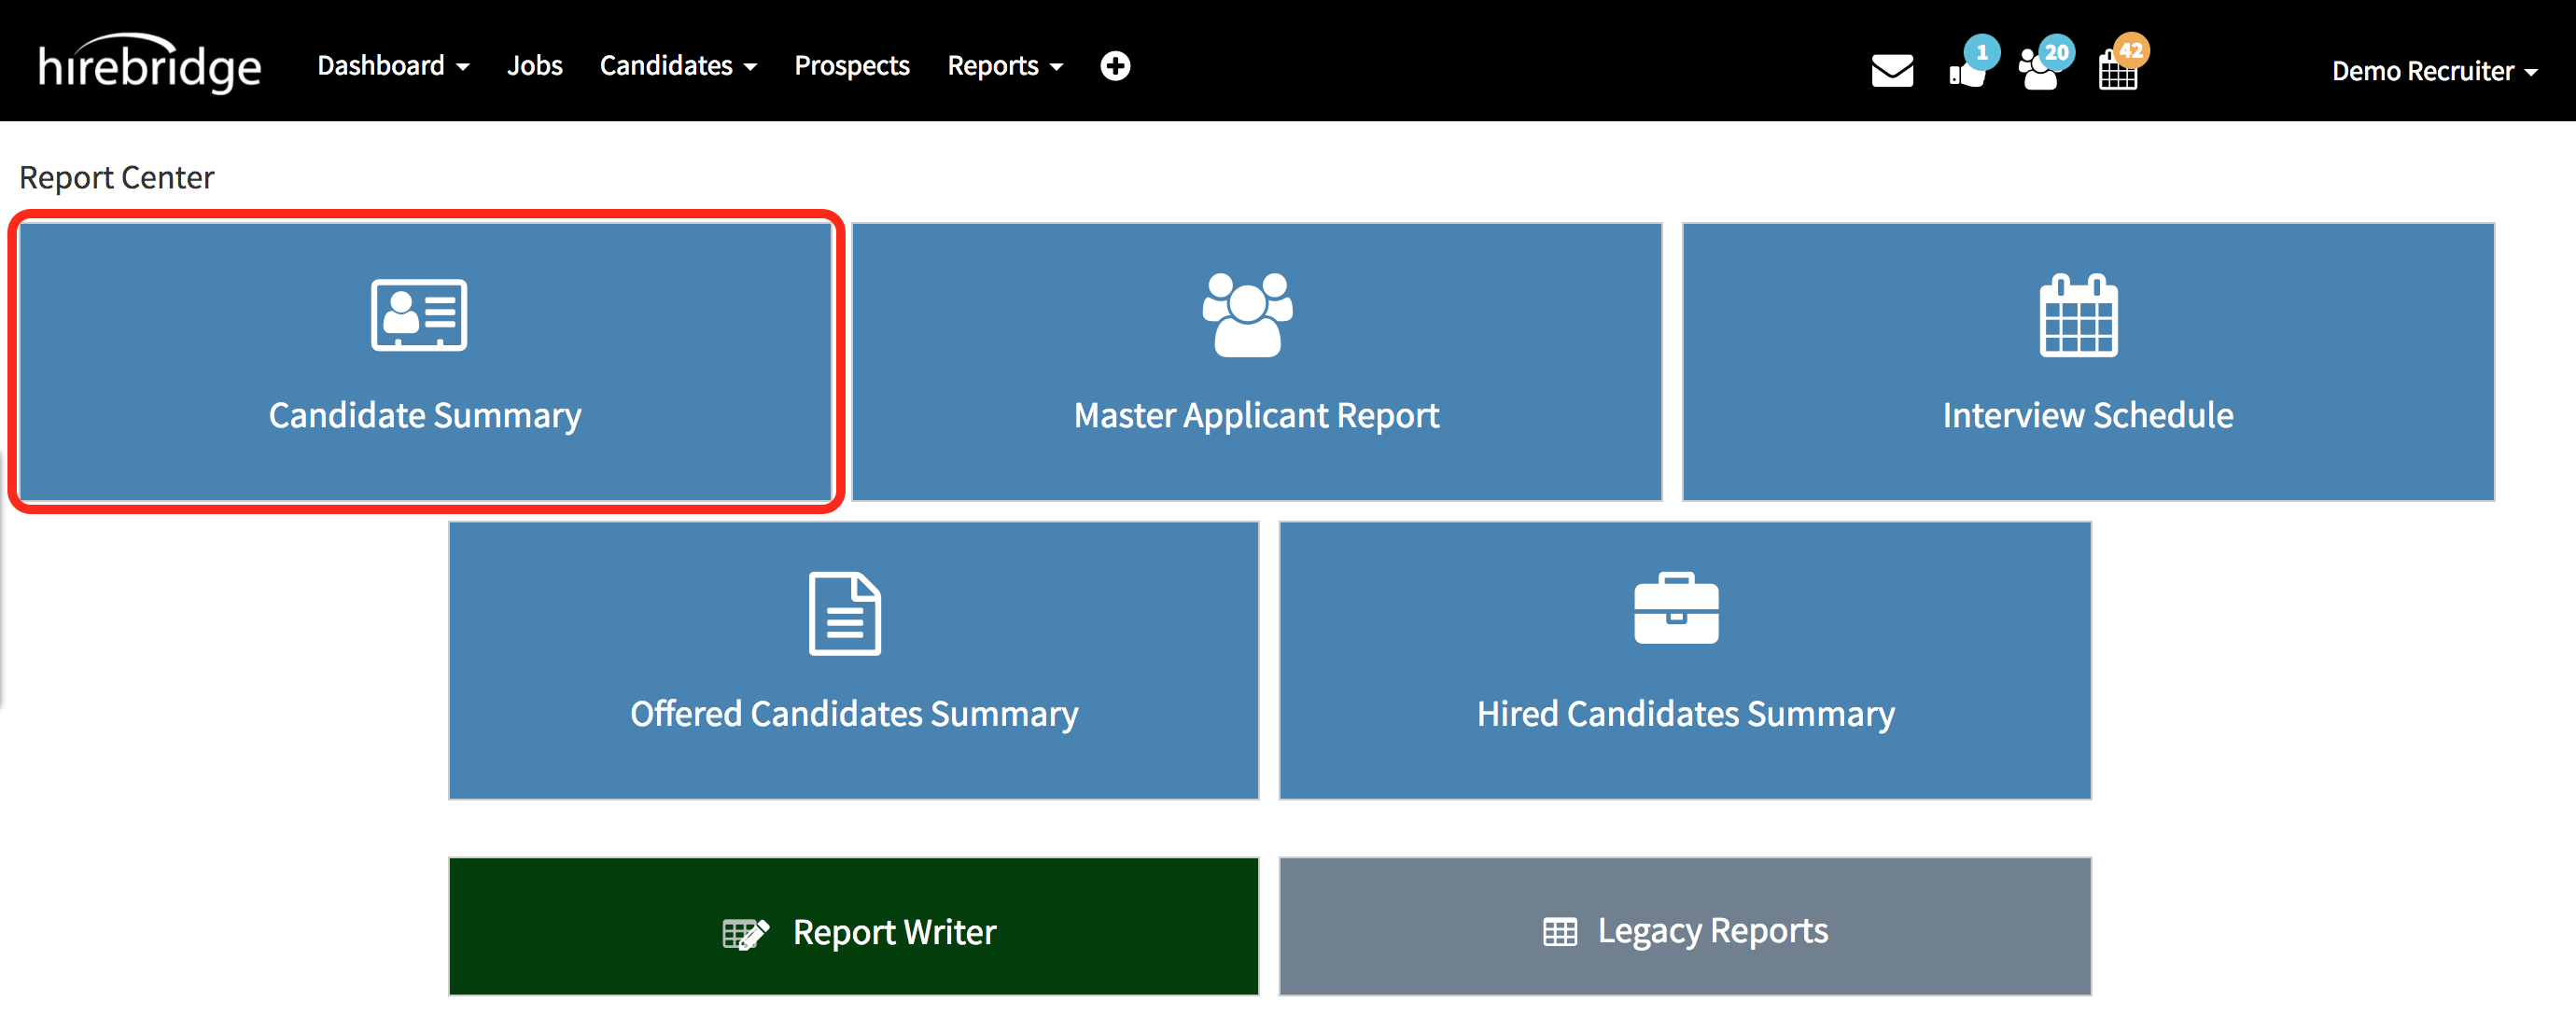
- This will now take you to the "Candidate Summary" report center.
(Pictured Below)
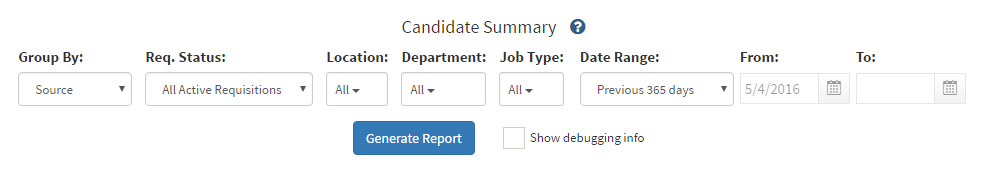
This report will analyze and summarize your candidates. You can choose one of 6 fields by which to group and sum the metrics; source (the campaign, Web site, employee, or vendor that led the candidate to your job page), job requisition owner (recruiter), job location, job category, job group, or job department.
The tables and charts will include a sum of the applicants, applications, assessments (if you are enabled for them), phone screens, interviews, hires, and offers (except that the phone screens, interviews, hires, offers, and assessments columns will be individually hidden if their sum is 0).
The difference between Applicants and Applications is that Applicants are the number of unique individuals (by e-mail address) while Applications are the number of completed job applications. In other words, a candidate who applies to 6 different jobs will be counted as a single Applicant but as 6 Applications.
For this example, I will run a candidate summary report by location.
(After you have selected the filters, select the blue "Generate Report" button)
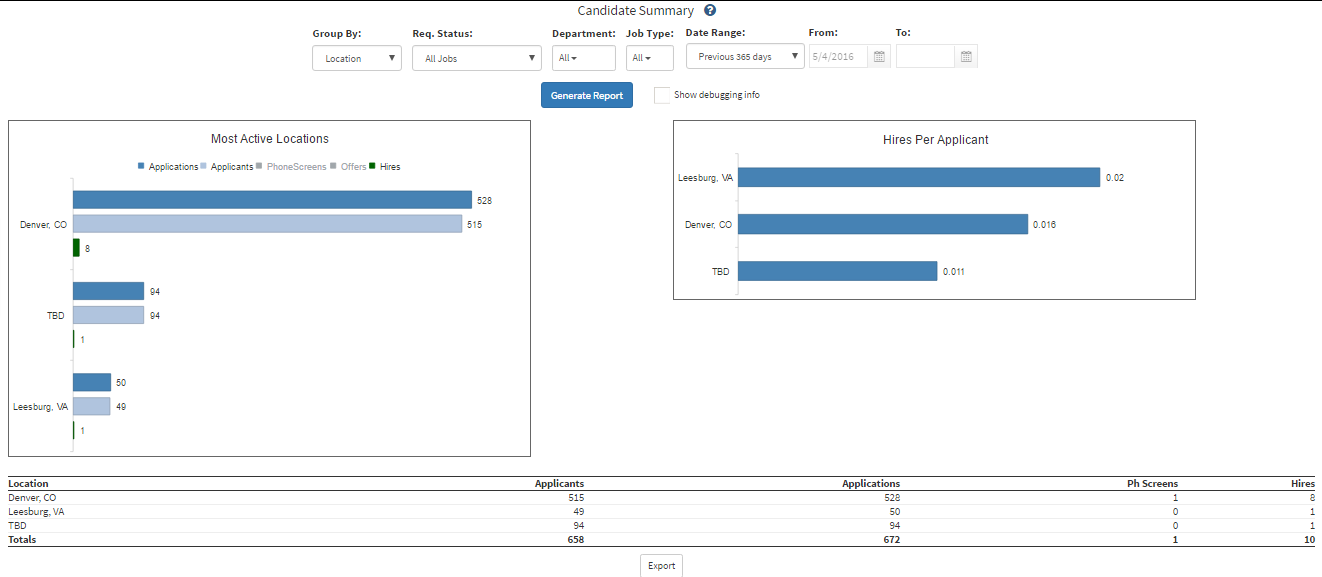
The two graphs you will see are based on "Most Active"(left) and "Hires Per Applicant"(right)
and based on the filters the information will populate into the graphs.
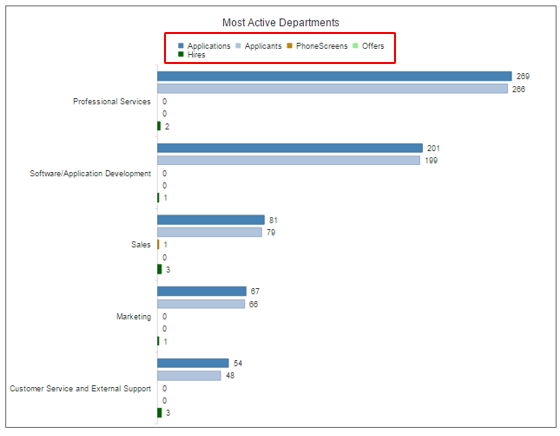
- In the graph "Most Active Departments" you are able to filter what information you would like to view in the graph.
- The outlined section below is selectable and allows you to view/hide the fields.
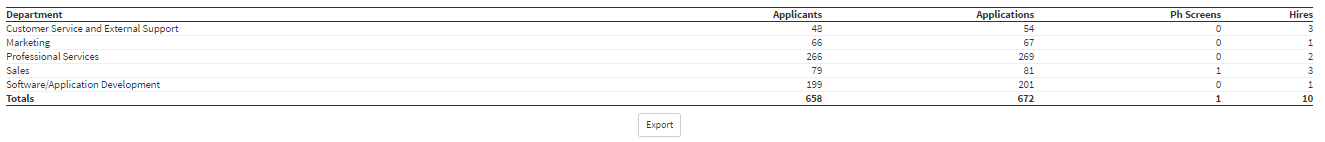
- At the bottom of the graphs, there will be the raw information based on the filters.
- If you would like to export the data there is an "Export" button at the bottom of the page which will export all the information via CSV.